The Significance of Data Visualization in the Modern Business Landscape
In today’s data-driven world, the role of a Data Visualization professional has become paramount, weaving together the realms of analytics and design. Let’s explore the multifaceted responsibilities and skills that define this crucial position, delving into the intricacies of data visualization and its impact on organizational decision-making.
Understanding the Role of a Data Visualization Specialist
A Data Visualization Specialist plays a pivotal role in transforming complex data sets into comprehensible visual representations, aiding stakeholders in making informed decisions. This role requires a unique blend of analytical prowess and creative flair. Let’s delve deeper into the key responsibilities that define the position:
- Analyze and interpret data to identify trends, patterns, and insights.
- Create visually appealing and easy-to-understand charts, graphs, and dashboards.
- Collaborate with cross-functional teams to understand data requirements and objectives.
- Stay abreast of emerging trends and technologies in data visualization tools and techniques.
- Effectively communicate findings to both technical and non-technical stakeholders.
- Ensure data visualizations align with organizational goals and enhance decision-making processes.
As a Data Visualization Specialist, you are not just presenting data; you are telling a story that guides strategic actions within the organization.
Essential Skills and Qualifications for a Data Visualization Specialist
Stepping into the role of a Data Visualization Specialist requires a unique skill set and a solid educational background. Let’s explore the key qualifications and skills that set the stage for success in this dynamic field:
- A degree in Data Science, Computer Science, Statistics, or a related field, providing a strong foundation.
- Proficiency in data visualization tools such as Tableau, Power BI, or D3.js.
- Advanced knowledge of statistical concepts and data analysis techniques.
- Expertise in graphic design principles to create visually compelling representations.
- Strong communication skills to convey complex findings in a clear and concise manner.
- Experience in storytelling through data, turning insights into actionable narratives.
Continuous learning and staying updated with the latest tools and techniques are key components of excelling in this ever-evolving field.
Key Responsibilities of a Data Visualization Specialist
The role of a Data Visualization Specialist is multifaceted, requiring a combination of technical proficiency and creative thinking. Let’s explore the core responsibilities that define this dynamic position:
- Transforming raw data into visually appealing and interactive dashboards.
- Collaborating with data scientists and analysts to understand data sources and requirements.
- Conducting thorough data validation and ensuring accuracy in visual representations.
- Customizing visualizations to cater to the specific needs of different stakeholders.
- Utilizing storytelling techniques to present data insights in a compelling manner.
- Conducting training sessions to enhance data literacy across the organization.
- Contributing to the development of best practices for data visualization within the team.
Each responsibility is a brushstroke, contributing to the masterpiece of informed decision-making within the organization.
Data Visualization Specialist CV Writing Tips
Crafting a compelling CV as a Data Visualization Specialist is crucial to stand out in a competitive job market. Here are some tips to ensure your CV effectively communicates your skills and experiences:
- Showcase a diverse portfolio of data visualizations, highlighting different tools and techniques.
- Quantify your impact by including metrics that demonstrate the value of your visualizations.
- Highlight your ability to work collaboratively by mentioning successful cross-functional projects.
- Include any relevant certifications in data visualization tools to bolster your credentials.
- Personalize your CV for each application, emphasizing skills and experiences that align with the job description.
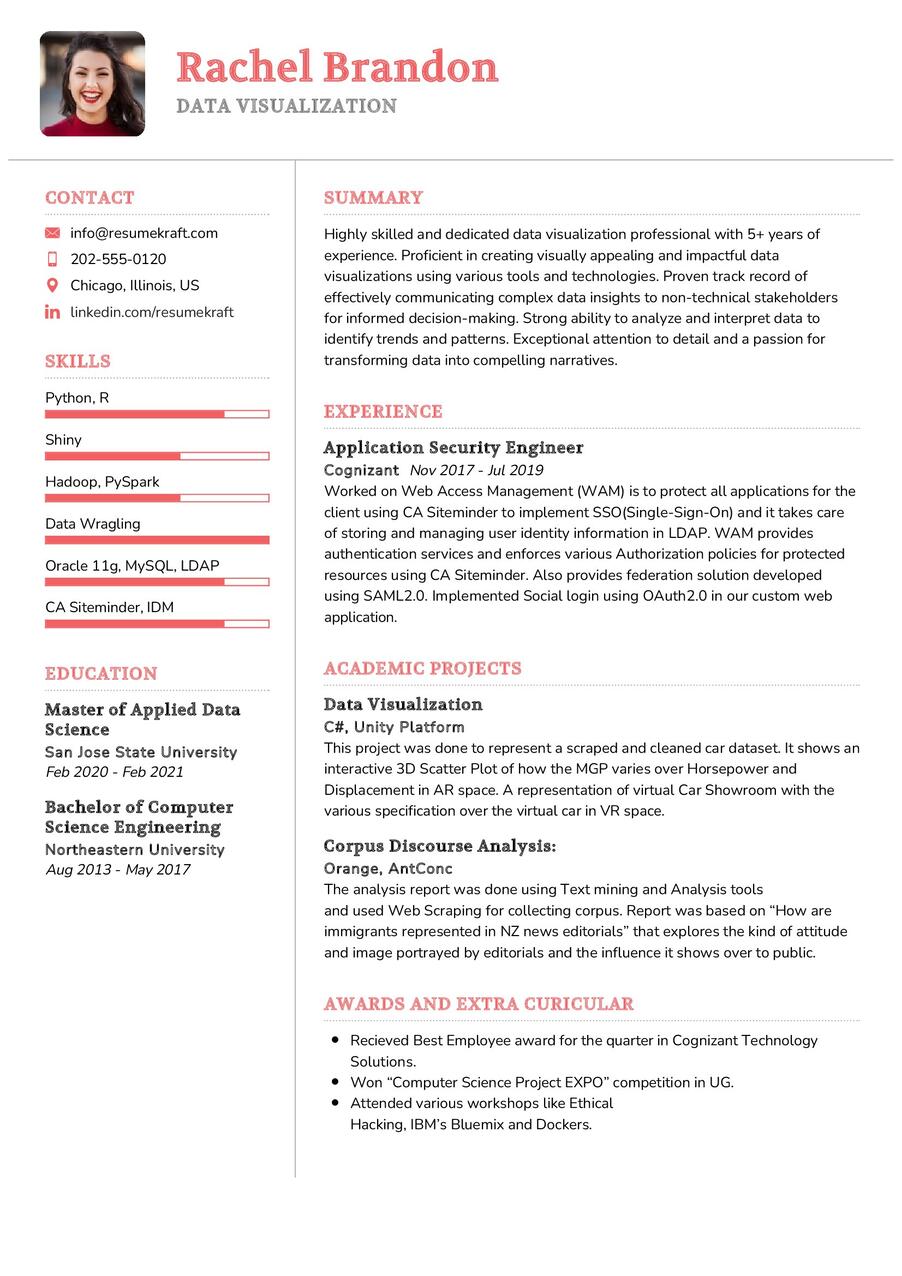
Your CV is your visual representation; make sure it reflects your expertise and tells a compelling story of your journey as a Data Visualization Specialist.
Data Visualization Specialist CV Summary Examples
Your CV summary is the gateway to your professional story, providing a snapshot of your skills and experiences. Here are some examples to inspire your CV summary:
- “Data Visualization Specialist with a passion for turning complex data into actionable insights, leveraging advanced tools such as Tableau to drive informed decision-making.”
- “Detail-oriented and creative Data Visualization Specialist with a proven track record of translating data into compelling visual stories that resonate with diverse stakeholders.”
- “Experienced professional in data visualization, adept at combining analytical rigor with design principles to deliver impactful visualizations that drive business outcomes.”
Your CV summary sets the tone for the rest of your CV, capturing the essence of your expertise and unique approach to data visualization.
Create a Robust Experience Section for Your Data Visualization Specialist CV
Your experience section is the core of your CV, narrating the story of your career journey. Here are some examples to guide you in creating a strong experience section:
- “Led a team in transforming raw data into interactive dashboards, resulting in a 30% improvement in data-driven decision-making across the organization.”
- “Collaborated with data scientists to visualize complex algorithms, simplifying the understanding of machine learning models for non-technical stakeholders.”
- “Developed and conducted data visualization workshops, enhancing the data literacy of team members and fostering a culture of informed decision-making.”
Each experience is a chapter in your career story, showcasing your contributions and impact in the field of data visualization.
Educational Background for Your Data Visualization Specialist CV
Your educational journey forms the foundation of your expertise. Here’s how you can present your educational background in your Data Visualization Specialist CV:
- Master of Science in Data Science, XYZ University, a comprehensive program that honed both analytical and visualization skills, 2018.
- Bachelor of Arts in Statistics, ABC University, providing a solid foundation in statistical concepts, 2015.
- Certified Data Visualization Professional, showcasing specialized training in advanced visualization techniques, 2019.
Your educational qualifications validate your knowledge and commitment to excellence in the field of data visualization.
Skills Essential for Your Data Visualization Specialist CV
Your skill set is your toolkit, reflecting the tools you’ve mastered in the realm of data visualization. Let’s outline the essential skills for a Data Visualization Specialist:
Technical Skills:
- Proficiency in data visualization tools: Tableau, Power BI, D3.js.
- Advanced knowledge of statistical concepts and data analysis techniques.
- Expertise in data storytelling, translating insights into impactful narratives.
- Graphic design skills for creating visually compelling representations.
- Experience in validating and ensuring accuracy in data visualizations.
Soft Skills:
- Effective communication to convey complex findings to diverse stakeholders.
- Collaboration and teamwork for successful cross-functional projects.
- Creative thinking to customize visualizations for different audiences.
- Continuous learning to stay updated with evolving tools and techniques.
Each skill is a tool, empowering you to create impactful visualizations and contribute to organizational success.
Common Mistakes to Avoid in Your Data Visualization Specialist CV
Avoiding common pitfalls is crucial when crafting your CV. Here are some mistakes to steer clear of:
- Overcrowding your CV with too many visual elements, potentially distracting from the content.
- Focusing solely on technical skills; ensure a balance with soft skills and collaborative experiences.
- Omitting specific examples of your impact in previous roles, missing an opportunity to showcase your value.
- Using generic language; tailor your CV to each application to stand out in a competitive job market.
- Neglecting to proofread; errors can detract from the professionalism of your CV.
Avoiding these mistakes ensures your Data Visualization Specialist CV is polished and effectively communicates your qualifications.
Key Takeaways for Your Data Visualization Specialist CV
As we conclude this comprehensive guide to crafting a standout Data Visualization Specialist CV, let’s recap the key points:
- Highlight the unique combination of your analytical and creative skills in data visualization.
- Showcase a diverse portfolio of impactful visualizations to demonstrate your proficiency.
- Quantify your impact through metrics, emphasizing the value you bring to organizations.
- Continuously update your skills and stay informed about the latest trends in data visualization tools.
Your CV is not just a document; it’s a visual representation of your expertise and a testament to your ability to transform data into actionable insights. Best of luck in your journey as a Data Visualization Specialist!
Finally, feel free to utilize resources like AI CV Builder, CV Design, CV Samples, CV Examples, CV Skills, CV Help, CV Synonyms, and Job Responsibilities to create a standout application and prepare for the [Data Visualization Specialist] job interview.


